Amazon Cost Explorer
Visualize, understand, and manage your Amazon costs and usage over time
Amazon Cost Explorer
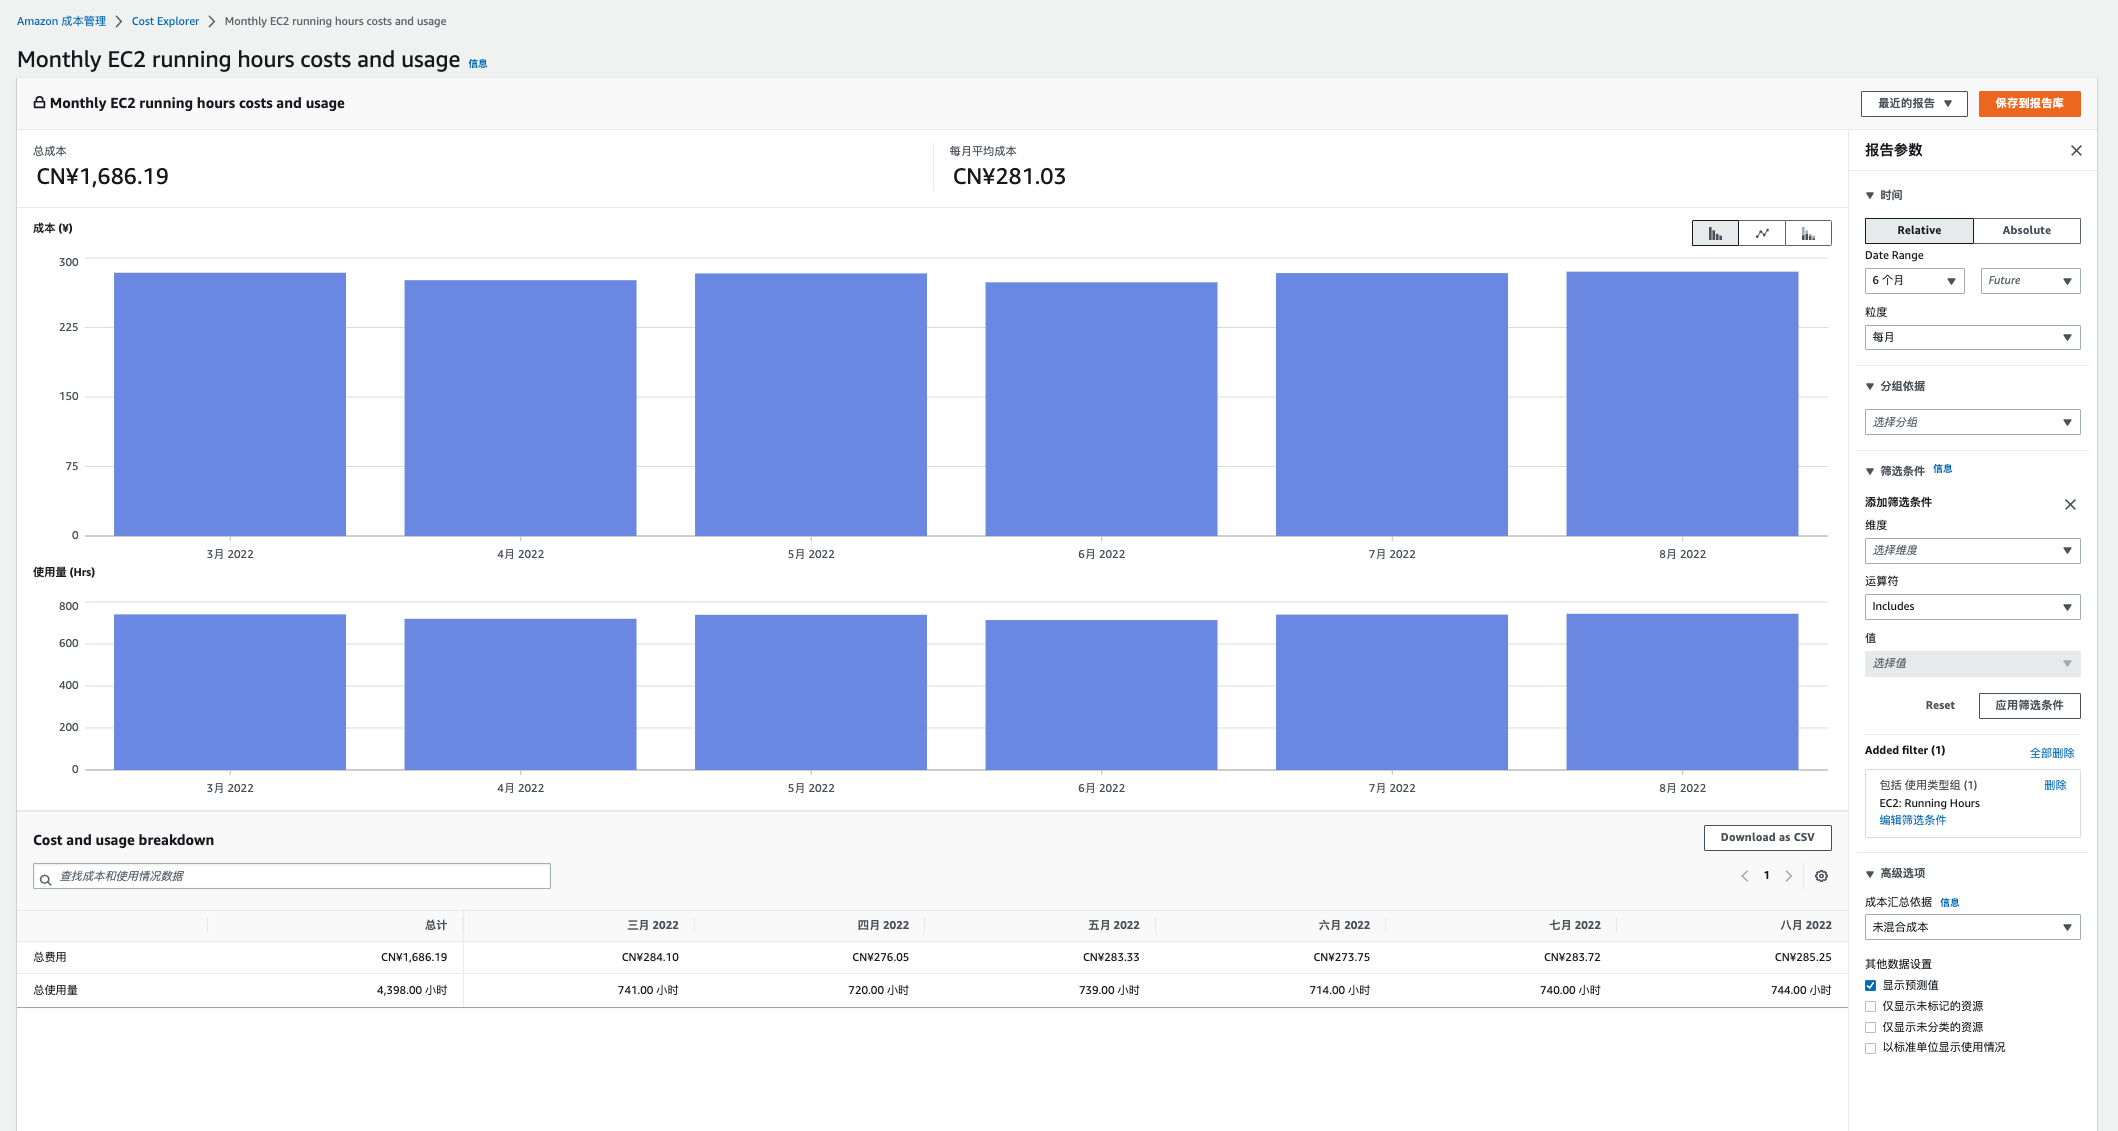
Amazon Cost Explorer has an easy-to-use interface that lets you visualize, understand, and manage your Amazon costs and usage over time.
Get started quickly by creating custom reports that analyze cost and usage data. Analyze your data at a high level (for example, total costs and usage across all accounts) or dive deeper into your cost and usage data to identify trends, pinpoint cost drivers, and detect anomalies.
Amazon Cost Explorer features
Get started quickly
A set of default reports are included to help you quickly gain insight into your cost drivers and usage trends.
Set time interval and granularity
Set a custom time period, and determine whether you would like to view your data at a monthly or daily level of granularity.
Filter/Group your data
Dig deeper into your data by taking advantage of filtering and grouping functionality, using a variety of available dimensions.
Forecast future costs and usage
Use forecasting to get a better idea of your what your costs and usage may look like in the future, so that you can plan ahead.
Save your progress
Once you arrive at a helpful view, save your progress as a new report that you can refer back to in the future.
Build custom applications
Directly access the interactive, ad-hoc analytics engine that powers Amazon Cost Explorer.
Getting started
Amazon Cost Explorer provides you with a set of default reports that you can use as the starting place for your analysis. From there, use the filtering and grouping capabilities to dive deeper into your cost and usage data and generate custom insights.
Monthly costs by Amazon service

Amazon Cost Explorer includes a default report that helps you visualize the costs and usage associated with your top five cost-accruing Amazon Web Services services, and gives you a detailed breakdown on all services in the table view. The reports let you adjust the time range to view historical data going back up to twelve months to gain an understanding of your cost trends.
Hourly and resource level granularity
Amazon Cost Explorer helps you visualize, understand, and manage your costs and usage over a daily or monthly granularity. The solution also lets you dive deeper using granular filtering and grouping dimensions such as Usage Type and Tags. You can also access your data with further granularity by enabling hourly and resource level granularity.