We use machine learning technology to do auto-translation. Click "English" on top navigation bar to check Chinese version.
Automate creation of Amazon CloudWatch alarms and dashboards with Amazon Web Services Systems Manager and Ansible
Monitoring
In this post, we describe how to use Amazon Web Services Systems Manager to create State Manager associations that can trigger Ansible playbooks to automatically create CloudWatch dashboards and alarms when an EC2 instance is created with a tag of your choice. The dashboard created displays not only the out-of-the-box metrics provided by CloudWatch, but also those that are gathered by CloudWatch agent.
Prerequisites
For this walkthrough, the following prerequisites are necessary:
-
An
Amazon Web Services account -
Target instances should be set up as managed instances. Please follow
this link for the setup. -
Ansible version of > 2.9 must be installed on the instances. Please refer to “Installing Ansible on target instances” section in
this link . -
Amazon SNS topic should be created and subscribed. Please follow
this link for the setup. -
Create an Amazon S3 bucket using
this link to store the Ansible code provided in later sections of this post. -
Managed instance created should be granted access in instance profile using
this link .
Solution overview
To automate management tasks by providing an easy and secure platform to maintain state and remotely execute commands on a group of instances, we will use
When you create a State Manager association, it will execute the Ansible playbook that creates the CloudWatch dashboard and alarms with the target selection based on the tags allocated to an EC2 instance. Hence, on creation of an EC2 instance with a selected tag; CloudWatch agent, dashboards, and alarms are automatically installed and created, which provide proactive monitoring.
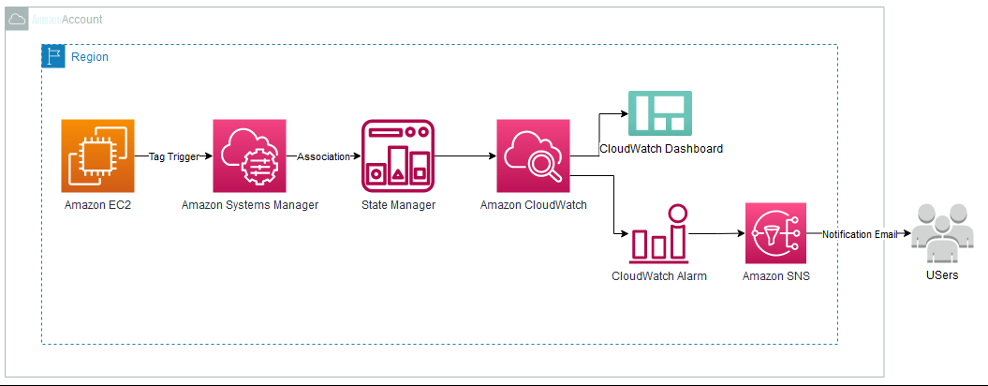
Image 1: Architecture of Amazon Web Services services used in this blog.
Some key performance metrics that are monitored on a regular basis to troubleshoot issues on the instances are listed below:
- CPU Utilization
- Memory Utilization
- Swap Utilization
- Disk Utilization
- Load Average
- Instance Status
- Network Status
This post focuses on automatically setting up CloudWatch dashboard and alarms for the above metrics on the creation of EC2 instances as a managed instance with a target tag defined. The code provided in this source is applicable only to Linux instances and is not supported for Windows OS.
Walkthrough
In this section, we walk through the process to set up the automation using State Manager which will execute the Ansible Playbook that installs CloudWatch agent and creates the CloudWatch dashboard and alarms. Let’s assume that you have fleet of managed instances where you want to set up the proactive monitoring and alerts in place with the appropriate IAM role already assigned to them.
Step 1: Download the source code
Source code that the automation uses to create dashboards and alarms is stored in a GITHUB repository. It is available in
Step 2: Edit the thresholds for CloudWatch metric alarms
This post will cover alarms that are defined for the following key performance metrics which are displayed on the dashboard.
- CPU Utilization
- Memory Utilization
- Swap Utilization
- Disk Utilization
- Instance Status
The source code that is downloaded consists of a variable file which defines the thresholds for alerts to be sent out when creating the alarms. These are defined in the file <location of downloaded code>/ roles/ amazon-cloudwatch-dashboard-alarms-with-ssm-ansible-role/vars. You can edit the threshold variables defined in this file across the ansible dictionary variables for you to define the thresholds as per your needs.
In the existing code, the thresholds for alerting on different metrics are defined below:
-
CPU Utilization
- Warning Threshold: 80%
- Critical Thresold: 90%
-
Memory Utilization
- Warning Threshold: 90%
- Critical Thresold: 100%
-
Swap Utilization
- Warning Threshold: 30%
- Critical Thresold: 50%
-
Disk Utilization
- Warning Threshold: 90%
- Critical Thresold: 95%
-
Instance Status
- Critical Threshold: 100
This means that whenever the instance becomes unavailable, an alert will be triggered.
Example of metrics CPU Utilization and Swap Utilization with their warning thresholds is shown in the snippet below.
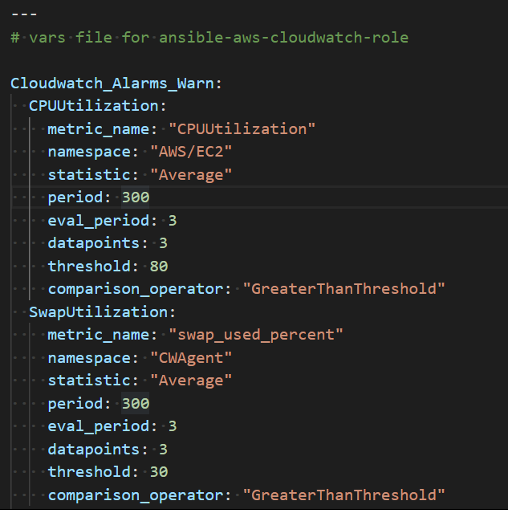
Image 2: Thresholds for cloudwatch metrics
Step 3: Upload the source code into Amazon S3 bucket
This source code needs to be uploaded onto the Amazon S3 bucket that was created as a part of pre-requisites. A snippet of the code uploaded is shown below.
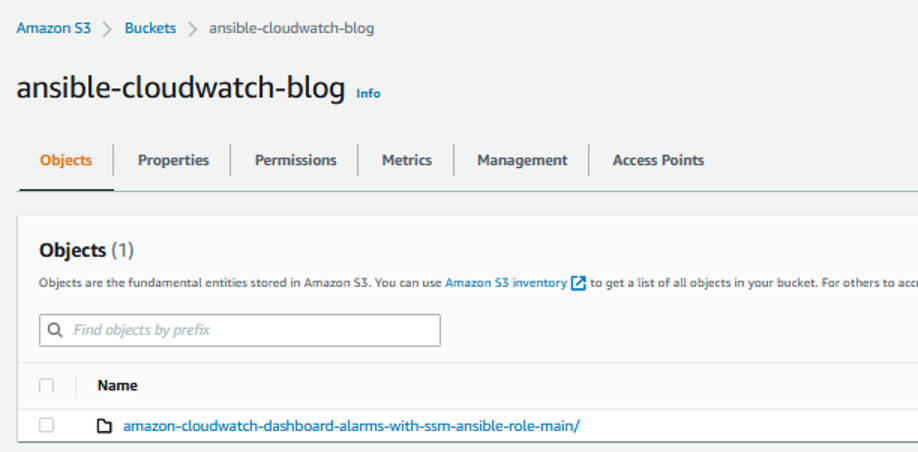
Image 3: Snapshot of code uploaded to s3 bucket
Step 4: Create State Manager Association
Log in to the Amazon Web Services Console and search for “Systems Manager” service in the search box. On the Systems Manager console, click “State Manager” on the left panel, and then click “Create association”.
Optionally provide name of the association, and select “Amazon Web Services-ApplyAnsiblePlaybooks” document. In the “Parameters” section, choose “Source Type” as S3, “Source info” as { “path”:”https://s3.amazonaws.com/<s3 bucket name>” }. In the example snippet below, “Source info” is set as { “path”:”https://s3.amazonaws.com/ansible-cloudwatch-blog” }
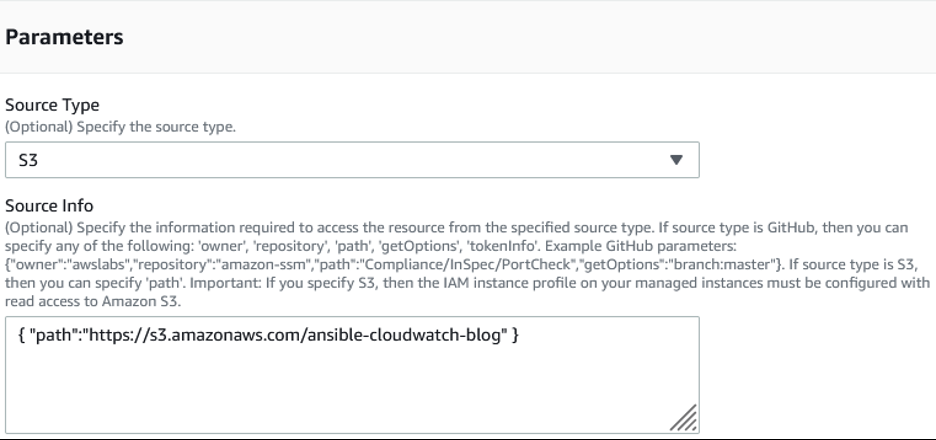
Image 4: Parameters for source information
Choose “Install Dependencies” as True, which will install Python and other required software.
For the “Playbook File”, specify the name of the file. In this case, it is “amazon-cloudwatch-dashboard-alarms-with-ssm-ansible-role-main/playbook.yml”. Note: The name of the file is based on its relative location to the S3 bucket. In the example snippet below, the file playbook.yml is in amazon-cloudwatch-dashboard-alarms-with-ssm-ansible-role-main directory within the S3 bucket cloudwatch-blog-ansible.

Image 5: Playbook details to execute
For “Extra Variables”, specify the key/value pairs separated by a space. Mandatory variables are shown below.
- warn_sns_topic_name=<Name of SNS Topic>
- critical_sns_topic_name=<Name of SNS Topic>
- ansible_python_interpreter=’/usr/bin/env python3′
The SNS topic names are needed for both warning and critical alerts which are distinguished based on the thresholds. Note: Do not change the Key name of the variable as that is dependent on the source code.
Example of the Extra Variables is shown in snippet below:

Image 6: Extra Variables to pass for the automation
For “Target selection”, you can choose to specify instance tags, resource group, all instances or choose instances manually. For more details refer to
In this example, we are choosing to specify instance tags as our “Target selection” since we want the monitoring and alarms to be created by a trigger mechanism on creation of EC2 instance with a specific tag. For example: Tag = CloudWatchAnsible:true as shown in snippet below.
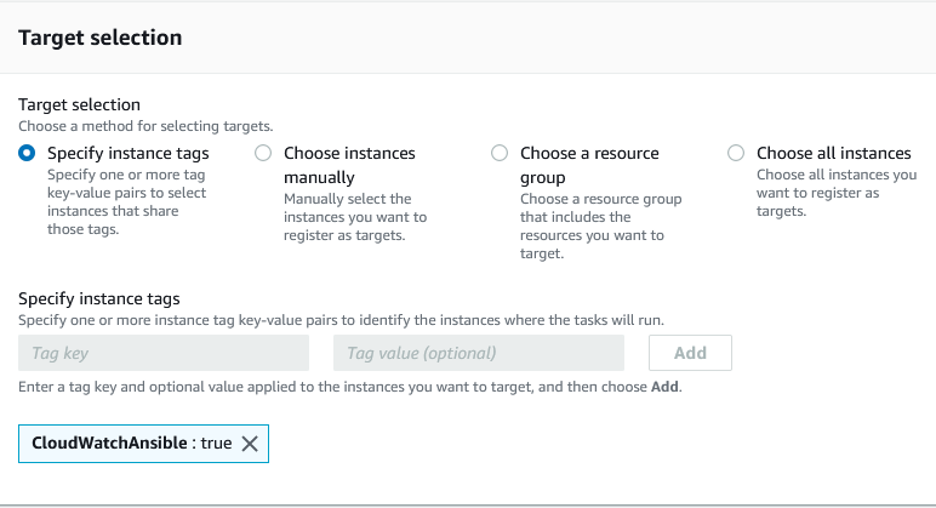
Image 7: Target selection for ansible automation execution
You can choose to run the State Manager association in a specific schedule so that whenever a new EC2 instance is created with required tags, State Manager will trigger the automation to execute the Ansible playbook at a scheduled frequency. In this post, we will choose “no schedule” as we already have instances with required tags.
Optionally, you can choose to save your output of the execution to an S3 bucket. In that case, select the “Enable writing output to S3.”
You can refer to
Step 5: Verify execution of Ansible playbook
Once the State Manager association is created, it will execute the Ansible playbook to install and configure the CloudWatch agent, and create the CloudWatch dashboard and alarms. The execution status can be verified by clicking on the association created and looking at the execution history as shown in snippet below.

Image 8: Verify execution of playbook
You can further examine the output based on each execution id and instance id as shown in the snippet below.

Image 9: Verify output of execution
Step 6: View the CloudWatch dashboard and alarms
To view the CloudWatch dashboard created in the Amazon Web Services Console, search for “CloudWatch” service and select “Dashboards” on the left panel. You will find the dashboards created with name “<instance_id>-Monitoring”. The picture below shows the dashboard created by the automation used in this post.
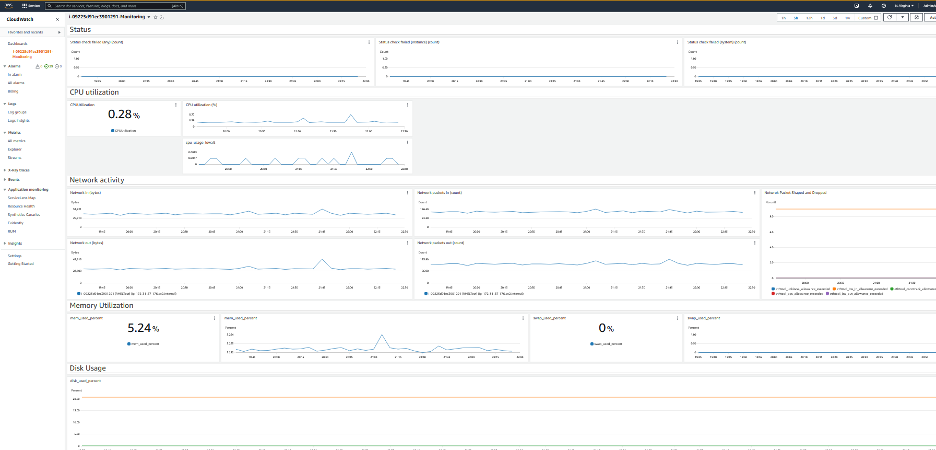
Image 10: Example of cloudwatch dashboard
To view the alarms created in CloudWatch service console, select “All alarms” on the left panel. You will find the alarms that got created on the instances as shown in the picture below.

Image 11: Example of Cloudwatch alarms
Summary
Monitoring and getting notified for issues on the instances is crucial to customers. A proactive monitoring and alerting mechanism using CloudWatch dashboards and alarms is a simple way to achieve this. You can use this solution of Amazon Web Services Systems Manager to create State Manager associations that can trigger Ansible playbooks to automatically create CloudWatch dashboards and alarms when an EC2 instance is created with a tag of your choice.
About the authors
The mentioned AWS GenAI Services service names relating to generative AI are only available or previewed in the Global Regions. Amazon Web Services China promotes AWS GenAI Services relating to generative AI solely for China-to-global business purposes and/or advanced technology introduction.