We use machine learning technology to do auto-translation. Click "English" on top navigation bar to check Chinese version.
Exporting the Windows Failover Cluster log to CloudWatch
In this deep-dive blog post, we will go through a step-by-step guide on how to capture
Introduction
Windows Event Viewer logs are a crucial aspect of monitoring and troubleshooting Windows systems. However, manually reviewing these logs can be time-consuming and error-prone. By using Amazon CloudWatch agent and Amazon SNS, you can automate the process of capturing and analyzing Event Viewer logs, as well as receive near real-time alerts in the event of critical system events.
Also take a look at Amazon
Solution overview
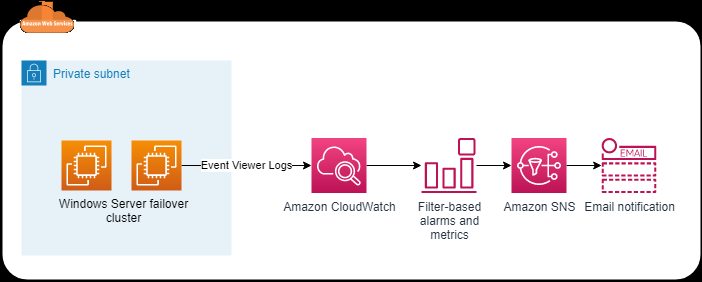
Figure 1. Solution overview
This solution includes the following steps:
-
Create a
Windows Server failover cluster (WSFC). - Publish the Event Viewer WSFC logs to Amazon CloudWatch using Amazon CloudWatch agent.
- Create a filter pattern and an Amazon CloudWatch alarm based on the Windows failover events.
- Use Amazon SNS to send an email if a failover/error event occurs.
Prerequisites
Before you start, complete the following tasks:
-
Start at least two Windows Server instances using available Windows AMIs.
Sample configuration used in this this blog post includes:- Windows Server 2019 – Version 1809
- SQL Server 2022 Developer Edition – (RTM) – 16.0.1000.6
-
Amazon Web Services Managed Microsoft AD - PowerShell 5.1.17763.3770
-
Amazon Web ServicesPowerShell module – 4.1.326
- Configure a Windows Server failover cluster between your nodes (Active/Passive).
-
Install and configure the
Amazon Web Services Command Line Interface (Amazon Web Services CLI ). -
Create an Amazon Web Services Identity and Access Management (
IAM) role with permissions for Amazon CloudWatch Logs and Amazon SNS. - Create an Amazon SNS topic to be used with the alarm.
Walkthrough
Step 1: Install Amazon CloudWatch agent on the Windows instance
The first step is to install the Amazon CloudWatch agent on the Windows instance. The Amazon CloudWatch agent is a lightweight data collection agent that can collect logs, metrics, and custom data from
To
- Log in to the Windows instance with local administrator permissions.
- Download the Amazon CloudWatch agent installer from the Amazon Web Services website using the following PowerShell script:
- Install the agent by running the following PowerShell script to start a silent setup:
- Repeat steps 1-3 on all Windows Server cluster nodes.
Step 2: Configure Amazon CloudWatch agent on the Windows instance
After the Amazon CloudWatch agent installation, the next step is to configure the Amazon CloudWatch agent on the Windows instance.
To configure the Amazon CloudWatch agent, perform the following steps:
-
- Log in to the Windows instance with local administrator permissions.
-
Create the Amazon CloudWatch agent configuration file and specify the System , Microsoft-Windows-FailoverClustering/Diagnostic and Microsoft-Windows-FailoverClustering/Operational Windows event log names during the configuration. - Your C:\Program Files\Amazon\AmazonCloudWatchAgent\config.json file should be like this:
-
Start the Amazon CloudWatch agent on the Windows instance by running the following PowerShell script with administrator permissions:
You should receive an outcome similar to the one presented in Figure 2:

Figure 2. Output of PowerShell script to start Amazon CloudWatch agent. -
Run the following PowerShell script to check the Amazon CloudWatch agent service status.
& $Env:ProgramFiles\Amazon\AmazonCloudWatchAgent\amazon-cloudwatch-agent-ctl.ps1 -m ec2 -a statusYou should receive an outcome similar to the one presented in Figure 3:

Figure 3. Output of PowerShell script to check the Amazon CloudWatch agent status. - Repeat steps 1-5 on all cluster nodes.
Once the service is started, it transmits logs to Amazon CloudWatch Logs. It may take a few minutes for Amazon CloudWatch Logs to include the initial data.
To locate the newly created log groups, navigate to the Amazon

Figure 4. Amazon CloudWatch log groups
The Microsoft-Windows-FailoverClustering/Operational log group contains one group for each Instance Id of your cluster nodes, as shown in Figure 5:
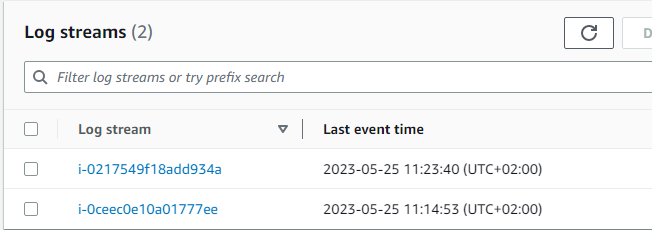
Figure 5. Log streams for each Amazon EC2 instance id.
Step 3: Create a filter pattern and Amazon CloudWatch alarm
You can create a filter for specific errors you want to monitor. Let’s create a filter to capture a failover event. The failover event will log the following event in the Event Viewer (FailoverClustering/Operational):
Log Name: Microsoft-Windows-FailoverClustering/OperationalEvent ID: 1641Level: InformationDescription:Clustered role '<role name>' is moving from cluster node '<PreviousNodeName>' to cluster node '<DestinationNodeName>'.
Now perform a test failover on your clustered resource. The error from Event Viewer should be in the Microsoft-Windows-FailoverClustering/Operational log group, as shown in Figure 6:
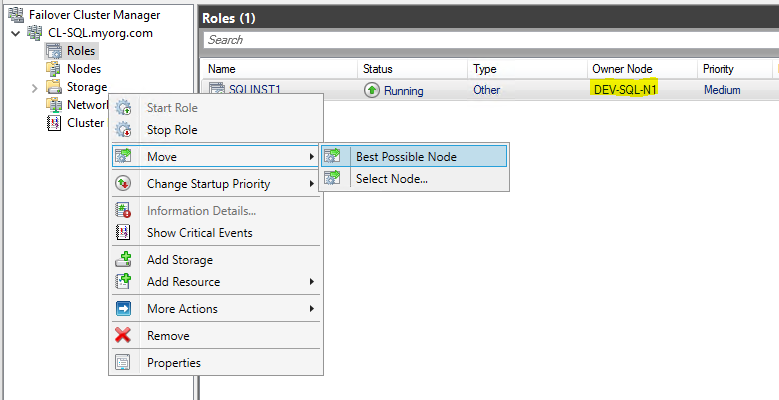
Figure 6. Performing a failover on Windows Failover Cluster resource.
The failover event is logged under Application and Services Logs / Microsoft/Windows/FailoverClustering/Operational System and Operational , as shown in Figure 7:
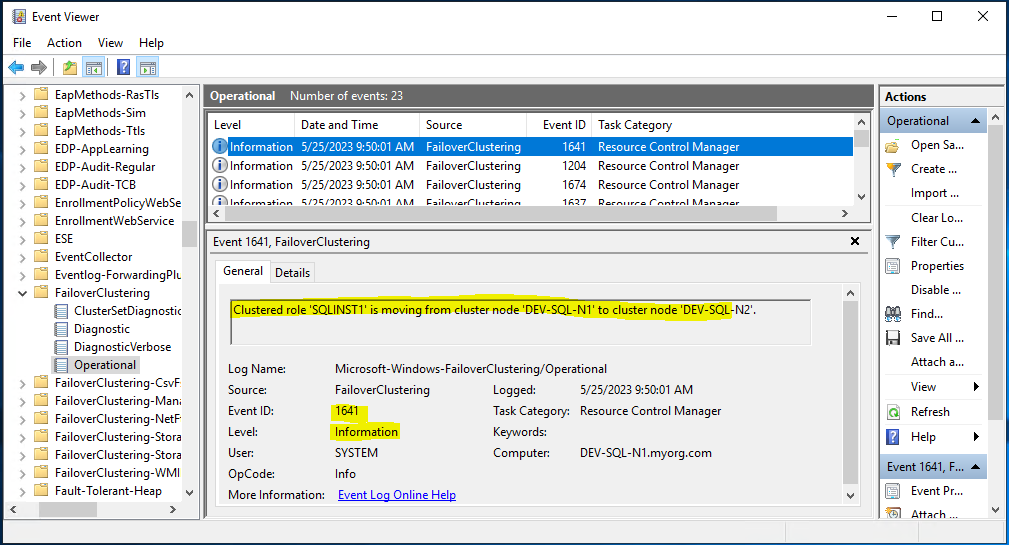
Figure 7. Event Viewer showing the log for failover operation.
-
On the Amazon CloudWatch console, under Logs, choose
Log groups/Microsoft-Windows-FailoverClustering/Operational,
choose
Search log group
, as shown in Figure 8:

Figure 8. Selecting logs group to create an Amazon CloudWatch filter. -
Search for
“[1641]”
, the EventId listed in Event Viewer after the failover. The console lists the matching failover events. To create a filter, choose
Create metric filter
, as shown in Figure 9:
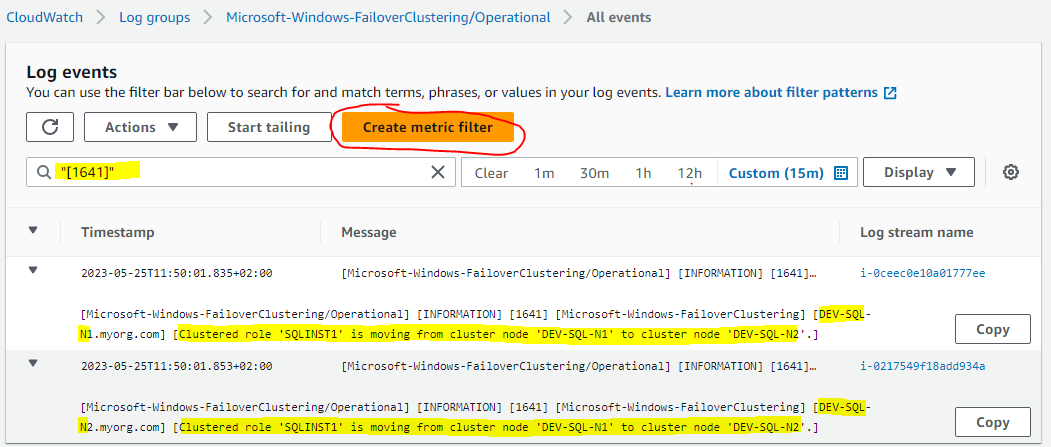
Figure 9. Creating a metric filter for the failover event ID. -
Under
Create metric filter
, do the following:
- For Filter name , enter failover.
- For Metric namespace , turn off Create new and choose CWAgent.
- For Metric name , enter failover.
- For Metric value , enter 1.
- For Unit , choose Count.
-
Choose
Create
.
Figure 10 shows your filter details:
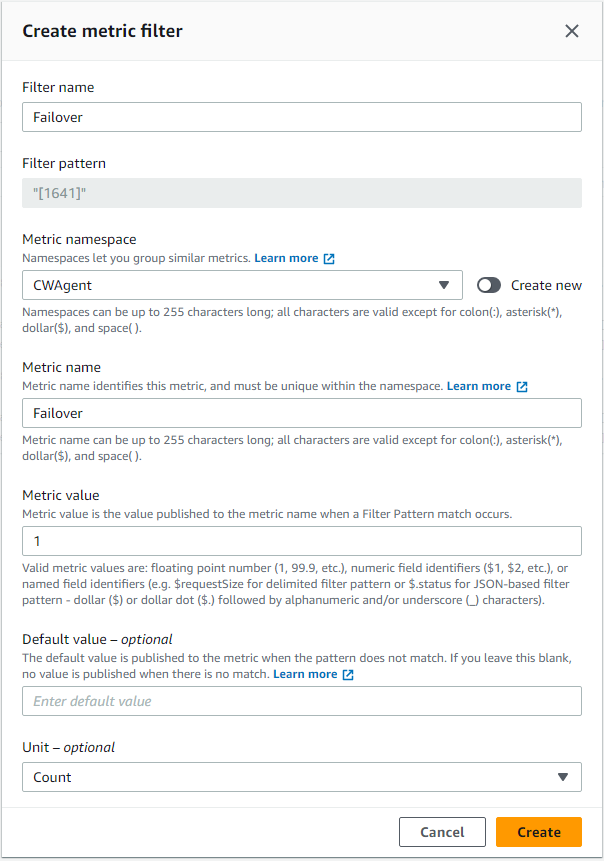
Figure 10. Metric filter details.
- Return to CloudWatch/Log groups/Microsoft-Windows-FailoverClustering/Operational . The filter you just created will be listed under Metric filters .
-
After creating the failover filter, we can now create the alarm. Choose the
Failover
filter and choose
Create alarm
, as shown in Figure 11:
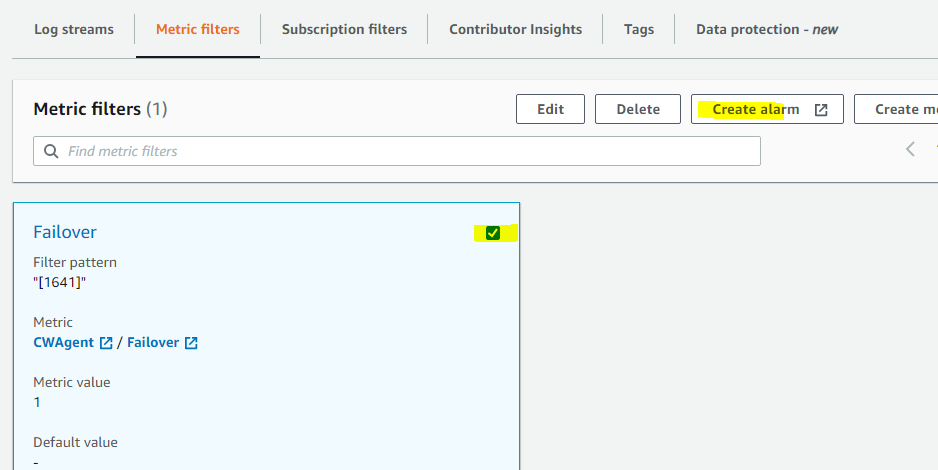
Figure 11. Creating an Amazon CloudWatch alarm. -
In the
Specify metric and conditions
page, do the following:
- For Metric name , enter Failover .
- For Statistic , choose Minimum .
-
For
Period
, choose the time for the alarm, for example,
1 minute
, as shown in Figure 12:
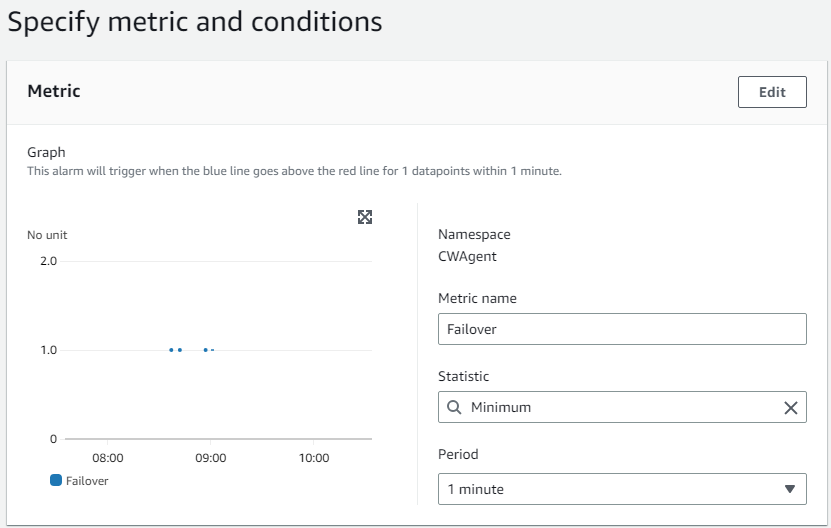
Figure 12. Specifying metrics for the alarm. - In the Conditions section, for Threshold type , choose Static .
- For Whenever Failover is , choose Greater > threshold .
- For Than , enter 0 .
-
Choose
Next
, as shown in Figure 13:
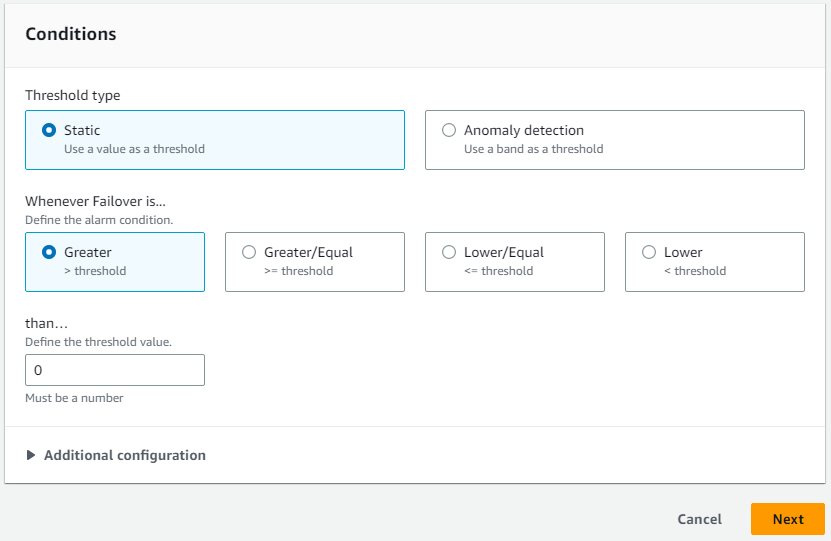
Figure 13. Specifying conditions for the alarm. - In the Notification section, for Alarm state trigger , choose In alarm .
-
For
Send a notification to the following SNS topic
, either:
- choose Select an existing Amazon SNS topic, then choose a topic;
-
or choose
Create new topic
to create an Amazon SNS topic using the email address you want to receive alerts, as shown in Figure 14:
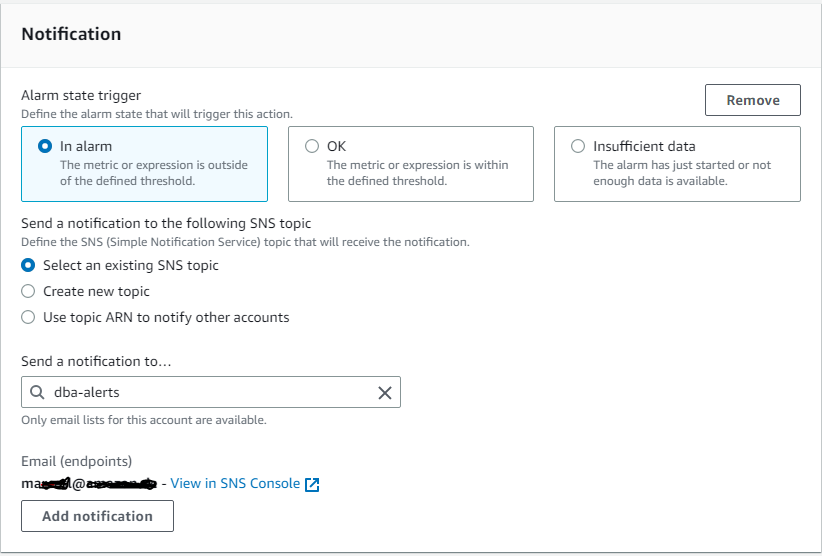
Figure 14. Selecting the notification method for the alarm.
- Choose Next .
- In the Name and description section, enter a name and description for your alarm.
-
Choose
Next
, as shown in Figure 15:
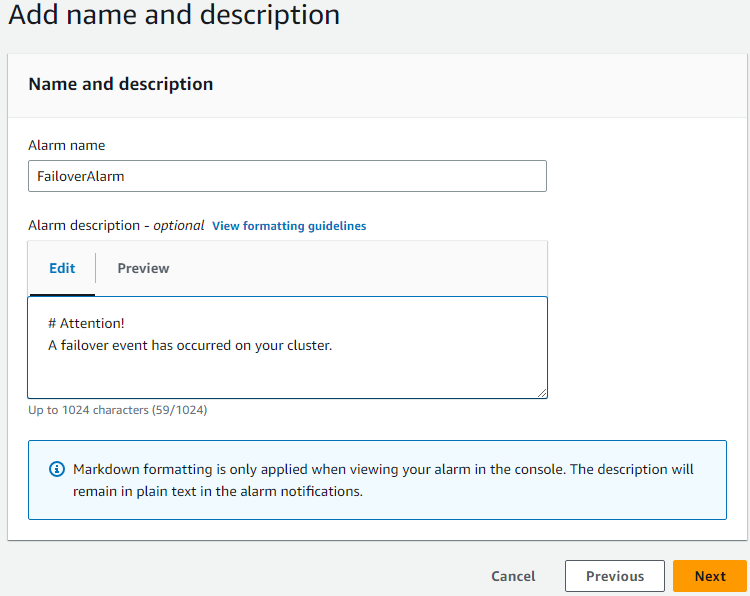
Figure 15. Specifying the alarm name and description. - In the Preview and create section, review your alarm configuration, then choose Create alarm .
Once you have completed the above steps, you can test the alerting workflow to ensure that it works as expected. To test the workflow, perform a failover on your cluster and check your email inbox. You will receive an email like the example in Figure 16:
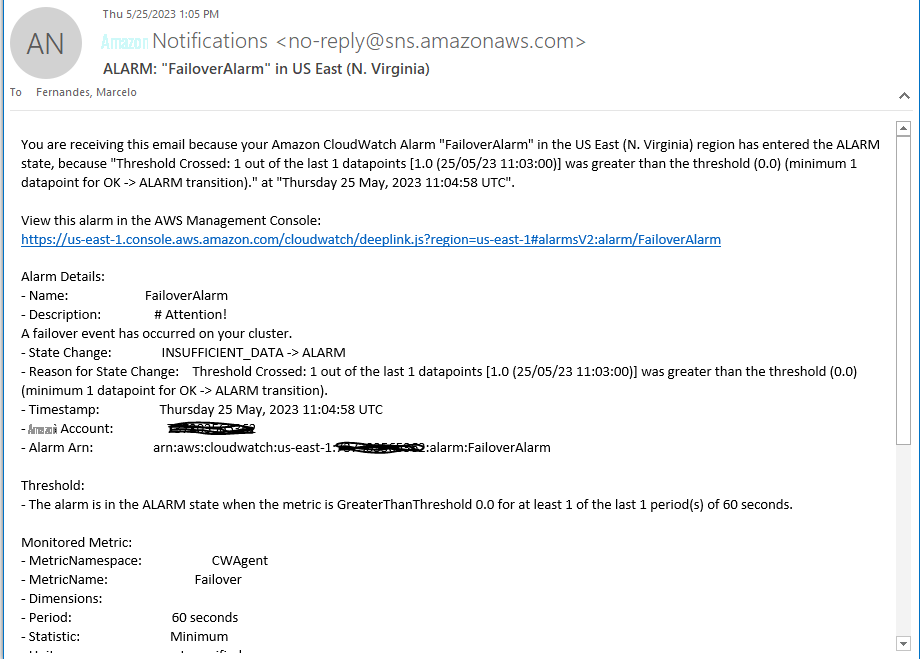
Figure 16. Notification email after a failover on WSFC role.
Monitoring additional failover cluster events
Now that you know how to create a filter and an alarm, you can create as many filters as you need. Here is a list of suggested events to monitor for a Windows Failover Cluster environment:
| Event Viewer | EventID | Level | Message |
| System | 1205 | ERROR | The Cluster service failed to bring clustered role ‘<Role name>’ completely online or offline |
| System | 1069 | ERROR | Cluster resource ‘<Resource name>’ of type ‘<Resource type>’ in clustered role ‘<Role name>’ failed |
| System | 1254 | ERROR | Clustered role ‘<Role name>’ has exceeded its failover threshold. |
| System | 1641 | ERROR | Clustered role ‘<Role name>’ is moving from cluster node ‘<Node name> ‘ to cluster node ‘<Node name> ‘. |
| System | 7034 | ERROR | The SQL Server (MSSQLSERVER) service terminated unexpectedly. |
| System | 1045 | WARNING | No matching network interface found for resource ‘<resource name>’ IP address ‘<IP address>’ |
| Microsoft-Windows-FailoverClustering/Operational | 1204 | INFORMATION | The Cluster service successfully brought the clustered role ‘<Role name’ offline. |
| Microsoft-Windows-FailoverClustering/Operational | 1637 | INFORMATION | Cluster resource ‘<Resource name>’ in clustered role ‘<Role name>’ has transitioned from state online to state ProcessingFailure. |
| Microsoft-Windows-FailoverClustering/Operational | 1674 | INFORMATION | Group ‘<Group name>’ has transitioned from state ‘<Current state>’ to state ‘<New state>’. |
Cleanup
To clear the Amazon CloudWatch alarm and stop Event Viewer from streaming to Amazon CloudWatch, follow these steps:
-
Stop streaming the Event viewer (repeat this process on all cluster nodes):
& $Env:ProgramFiles\Amazon\AmazonCloudWatchAgent\amazon-cloudwatch-agent-ctl.ps1 -m ec2 -a stop -
Uninstall Amazon CloudWatch agent (repeat this process on all cluster nodes):
          $app = Get-WmiObject -Class Win32_Product -Filter "Name = 'Amazon CloudWatch Agent'"


$app.Uninstall() -
Remove failover metric filter. You can use the Amazon Web Services Management Console or the following PowerShell script to remove the Amaon CloudWatch metric filter:
Get-CWLMetricFilter -FilterNamePrefix "Failover" | Remove-CWLMetricFilter -
Remove the log group streams. You can use the Amazon Web Services Management Console or the following PowerShell script to remove the Amazon CloudWatch log group streams:
          Get-CWLLogGroup | ?{$_.LogGroupName -eq "System" -or $_.LogGroupName -eq "Microsoft-Windows-FailoverClustering/Operational" }| Foreach-Object{ $LogGroupName = $_.LogGroupName


Get-CWLLogStream -LogGroupName $LogGroupName |foreach { Remove-CWLLogStream -LogGroupName $LogGroupName -LogStreamName $_.LogStreamName}} -
If you want, you can also delete the Amazon CloudWatch log group (make sure there are no logs other than the logs used in this blog). You can use the Amazon Web Services Management Console or the following PowerShell script to remove the Amazon CloudWatch log group:
Get-CWLLogGroup | ?{$_.LogGroupName -eq "System" -or $_.LogGroupName -eq "Microsoft-Windows-FailoverClustering/Operational" }| Remove-CWLLogGroup
Conclusion
In this blog post, we have provided step-by-step instructions on how to capture Windows Event Viewer logs using Amazon CloudWatch agent, how to create a metric based on an EventID , and send alerts using Amazon SNS. By automating, capturing, and analyzing logs, as well as receiving near real-time alerts in the event of critical system events, you can save time and reduce the risk of human error.
Amazon Web Services has significantly more services, and more features within those services, than any other cloud provider, making it faster, easier, and more cost effective to move your existing applications to the cloud and build nearly anything you can imagine. Give your Microsoft applications the infrastructure they need to drive the business outcomes you want. Visit our .
The mentioned AWS GenAI Services service names relating to generative AI are only available or previewed in the Global Regions. Amazon Web Services China promotes AWS GenAI Services relating to generative AI solely for China-to-global business purposes and/or advanced technology introduction.