We use machine learning technology to do auto-translation. Click "English" on top navigation bar to check Chinese version.
Preventing log loss with non-blocking mode in the Amazon Web ServicesLogs container log driver
Introduction
For improved observability and troubleshooting, it is recommended to ship container logs from the compute platform to a container running on to a centralized logging server. In the real world, the logging server may occasionally be unreachable or unable to accept logs. There is an architectural tradeoff when designing for log server failures. Service owners must choose from the following considerations:
- Should the application stop responding to traffic (or performing work) and wait for the centralized logging server to be restored? (i.e., is an accurate audit log higher priority than service availability?)
- Should the application continue to serve traffic while buffering logs in the hope that the logging server comes back before the buffer is full. Should you accept the risk of log loss in the rare case when the log destination is unavailable?
In container
In this post, we’ll dive into non-blocking , and show the results of log loss testing with the Amazon Web ServicesLogs logging driver.
Solution overview
Amazon Web ServicesLogs driver modes
In Amazon Elastic Container Service (
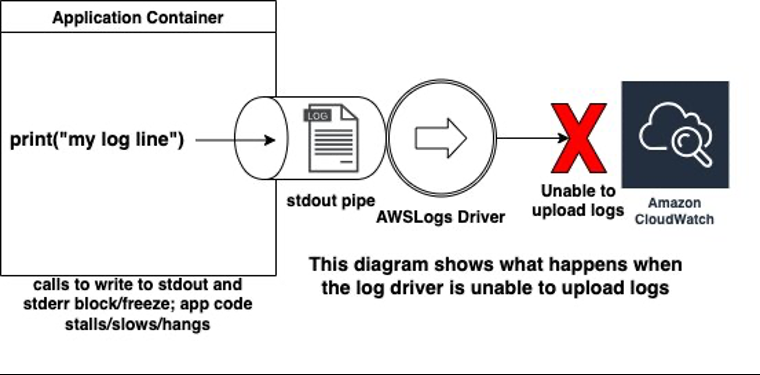
- blocking ( default ): When logs cannot be immediately sent to Amazon CloudWatch, calls from container code to write to stdout or stderr will block and halt execution of the code. The logging thread in the application will block, which may prevent the application from functioning and lead to health check failures and task termination. Container startup fails if the required log group or log stream cannot be created.
-
non-blocking: When logs cannot be immediately sent to Amazon CloudWatch, they are stored in an in-memory buffer configured with the max-buffer-size setting. When the buffer fills up, logs are lost. Calls to write to stdout or stderr from container code
won’t block
and will immediately return. With Amazon ECS on Amazon Elastic Compute Cloud (
Amazon EC2 ), container startup won’t fail if the required log group or log stream cannot be created. With Amazon ECS onAmazon Web Services Fargate , container startup always fails if the log group or log stream cannot be created regardless of the mode configured.

Should I switch to the non-default non-blocking mode?
Due to the application availability risk of the default blocking mode, service owners may consider switching to the non-blocking mode instead. This raises these questions:
- How should you choose the max-buffer-size? Can the default 1 MB size prevent log loss?
- Will the non-blocking mode lead to log loss for applications that log at a high rate?
To answer these questions, the Amazon Web Services team ran log ingestion tests at scale on the Amazon Web ServicesLogs driver in non-blocking mode.
What value for max-buffer-size is recommended?
If you choose non-blocking mode, then the recommended Amazon ECS Task Definition settings from this testing are the following:
Which variables determine how large the buffer should be?
The main variable that influences the maximum buffer size needed is how frequently the application outputs data and the log throughput.
Use the
It is recommended to over-estimate the log throughput from each container; log output may spike occasionally, especially during incidents. If possible, calculate your throughput during a load test or recent incident. Use the peak log output rate over a time interval of a minute or less, to account for bursts in throughput.
What did the tests find?
Please be aware that the results discussed in this post don’t represent a guarantee of performance. We are simply sharing the results of tests that we ran.
Here are the key findings when the central logging server is available and healthy.
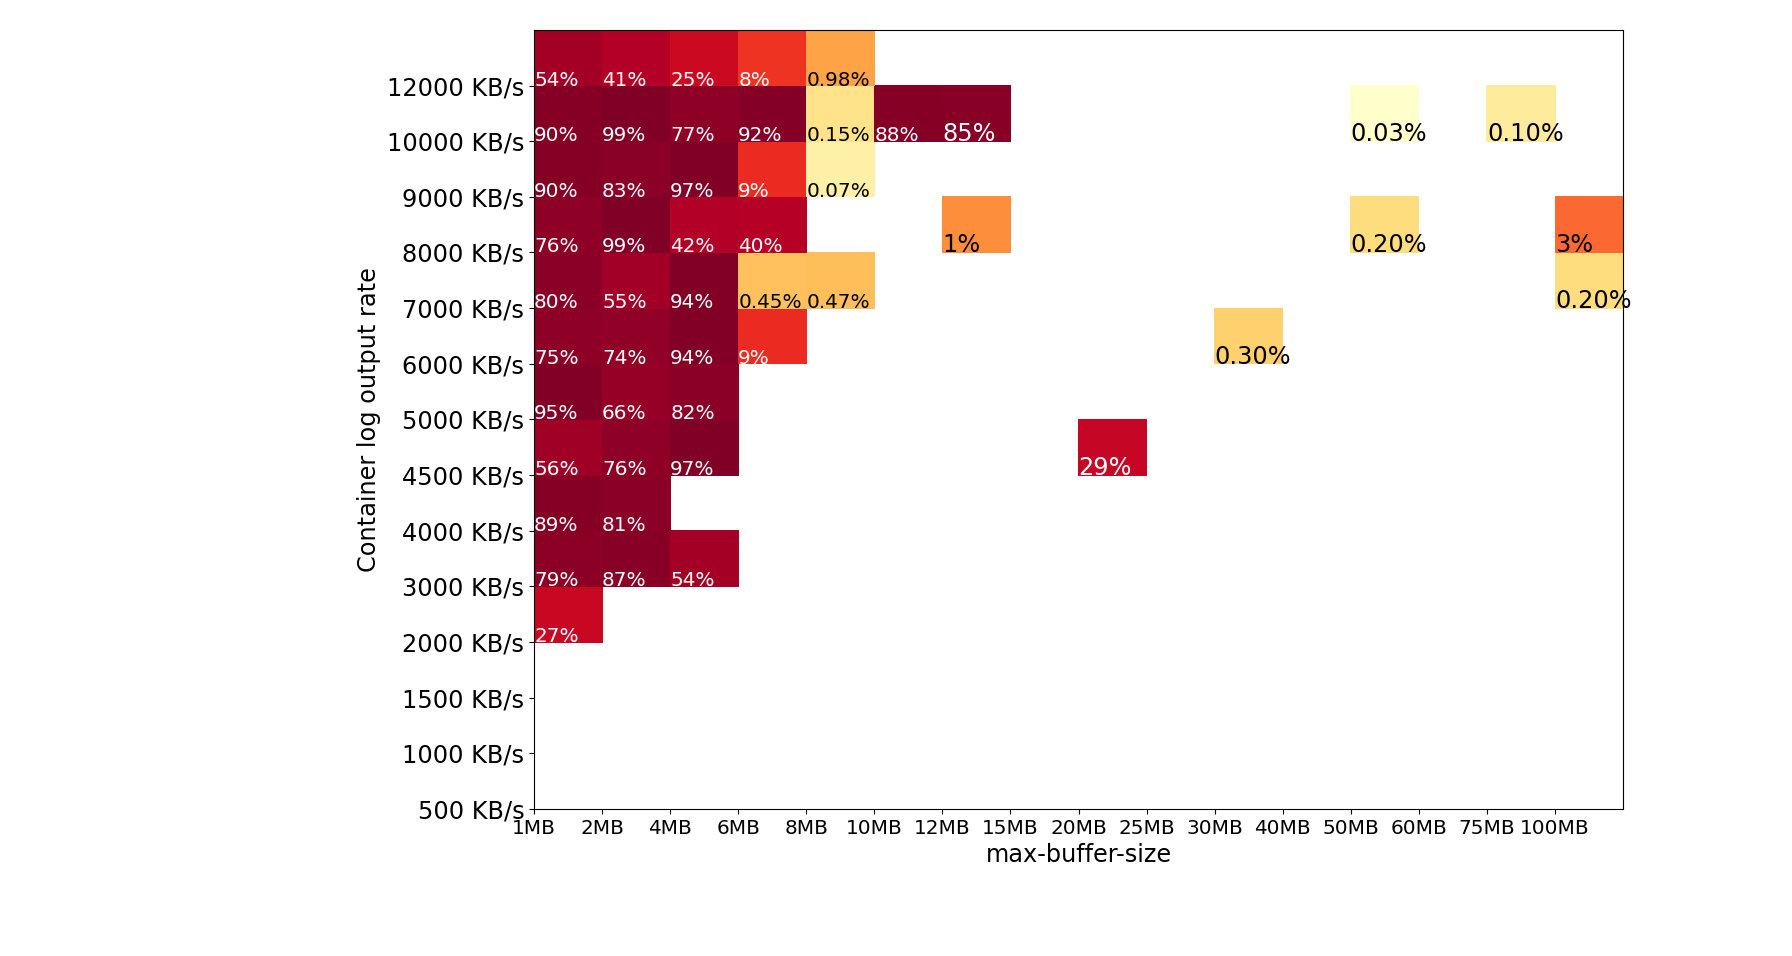
- max-buffer-size of >= 4MB doesn’t show any log loss for <= 2 MB/s log output rate from the container.
- max-buffer-size of >= 25 MB doesn’t show any log loss for <= 5MB/s log output rate from the container.
- Above 6 MB/s, the performance of the Amazon Web ServicesLogs driver is less predictable and consistent. For example, there was an outlier test failure with a 100 MB buffer and 7 MB/s. If you log at 6+ MB/s (sustained or burst), it may not be possible to prevent occasional log loss.
- The results are similar for Amazon ECS on Amazon EC2 launch type compared with the Amazon Web Services Fargate launch type.
This document presents a simple summary of the test results. The full benchmark results, analysis, and data broken down by launch type and log size, can be found on
How were tests run?
The code used for benchmarking can be found on
Each log loss test run was an Amazon ECS Task that sends 1 GB of log data to Amazon CloudWatch Logs with the Amazon Web ServicesLogs Driver. The task then queries Amazon CloudWatch Logs to get back all log events and checks how many were received. Each log message has a unique ID that is a predictable sequence number. Tests were run with 1 KB and 250 KB-sized single log messages.
Several thousand test runs were executed to acquire sufficient data for meaningful statistically analysis of log loss.
How do I know if the buffer is full and logs are lost?
Unfortunately, with the Amazon Web ServicesLogs logging driver there is no visibility into logs lost by the non-blocking mode buffer. There is no log statement or metric emitted by the Docker Daemon when loss occurs. Please comment on the proposal for log loss metrics on
How the does the buffer size effect the memory available to my application?
The max-buffer-size setting controls the
Does the compute platform effect the buffer size?
In our testing, we found that the results are similar with Amazon ECS Tasks launched on both Amazon EC2 and Amazon Web Services Fargate.
Is the non-blocking mode safe when send logs across Regions?
Amazon Web ServicesLogs driver can upload consistently at a much higher rate when sending logs to the Amazon CloudWatch API in the same Region as the test task, due to lower latency connections to CloudWatch. Cross-region log upload is less reliable. Moreover, it violates the best practice of Region isolation. Cross-region log push also incurs higher network cost.
Test results
Please be aware that the results discussed in this post don’t represent a guarantee of performance. We are simply sharing the results of tests that we ran. Please see
Summary of in-region test runs
Below is a heat-map summary of approximately 17,000 in-region test runs. The percent annotation inside the shaded box is the percent log loss in the worst test run. The darker the red shade, the more log loss was observed. Notice that there was no log loss for all test runs with log output rate less than 2 MB/s.

Summary of cross-region test runs
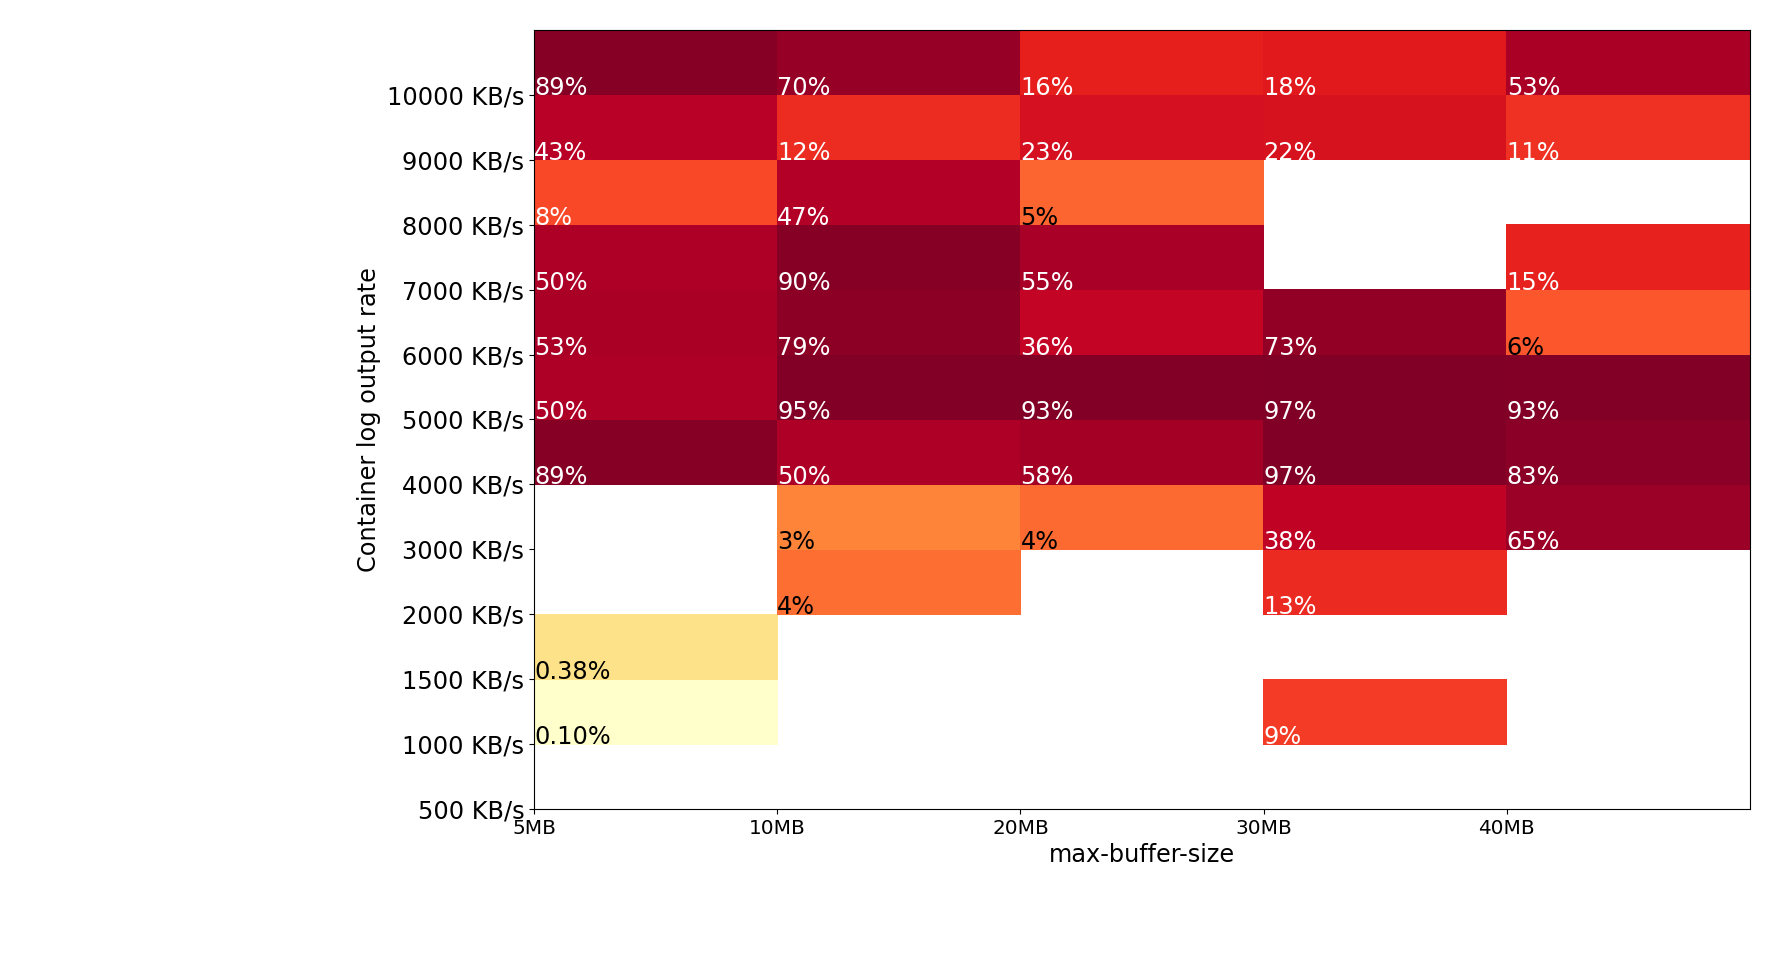
Tasks were run in us-west-2 uploading to Amazon CloudWatch in us-east-1.
The results show that cross-region log uploads are less reliable and require a much larger buffer size to prevent log loss.

Conclusion
In this post, you learned:
- The tradeoff between application availability and log loss with container log drivers blocking and non-blocking.
- How the Amazon Web ServicesLogs driver performs in non-blocking mode with different values of max-buffer-size.
- Cross-region log upload is not recommended and has a much higher risk of log loss with non-blocking.
- How to find your own log output rate per container.
- It isn’t possible to monitor for log loss with Amazon Web ServicesLogs driver in non-blocking.
When considering the tradeoff between application availability and log loss, you should decide whether your use case requires blocking or non-blocking mode. If you choose the application availability side of the trade-off, then should you choose Amazon Web ServicesLogs driver in non-blocking mode or another log collection solution? Most other log collection solutions, such as
The mentioned AWS GenAI Services service names relating to generative AI are only available or previewed in the Global Regions. Amazon Web Services China promotes AWS GenAI Services relating to generative AI solely for China-to-global business purposes and/or advanced technology introduction.